Question
The following table shows the estimated number of organisms recorded in a dam.
(a)
(a) Construct a possible food chain for the dam?
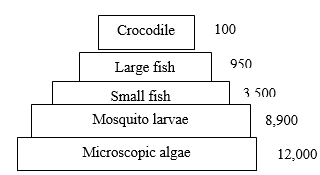
(b) Construct a pyramid of numbers for the given data?
(c) Explain the shape of pyramid obtained?
(a)
| Organisms | Number |
|---|---|
| Small fish | 3500 |
| Microscopic algae | 12000 |
| Crocodiles | 100 |
| Large fish | 950 |
| Mosquito larvae | 8900 |
(a) Construct a possible food chain for the dam?
(b) Construct a pyramid of numbers for the given data?
(c) Explain the shape of pyramid obtained?
Answer
(a) Microscopic algae → mosquito larvae → small fish → large fish crocodile
(b)

(c) (i) Body size of the organism increase at each trophic level from the base as their numbers decrease.
(ii) At each trophic level much of the energy obtained is lost in respiration thus fewer organisms can be supported at the succeeding level
(b)

(c) (i) Body size of the organism increase at each trophic level from the base as their numbers decrease.
(ii) At each trophic level much of the energy obtained is lost in respiration thus fewer organisms can be supported at the succeeding level

