Esoma-KE Logo
Change Class  |  Change Subject

Analyzing Crop Production Data

Select Subject  |  Geography


Want to enjoy learning? Try reading without Ads!

Say goodbye to distractions and enjoy uninterrupted learning with our new ad-free feature. Dive into our vast collection of educational content without any interruptions.

Explore Ad-Free learning plus lots of other premium benefits for as little as KES 200 per month.


Analyzing Crop Production Data

Question

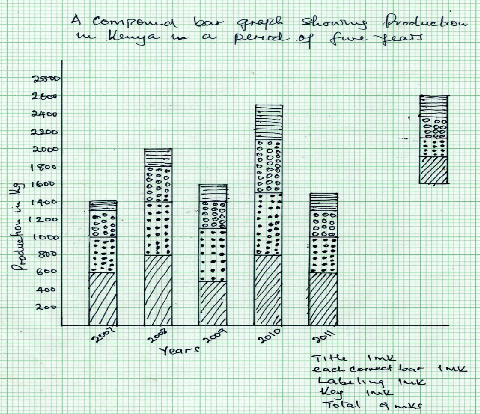
The table below shows crop production in Kenya in tonnes for a period of five years.

Crop/Year 2007 2008 2009 2010
Maize 600 800 700 800
Peas 400 600 400 700
Onions 300 400 300 600
Cabbage 100 200 200 400

Using a vertical scale of 1cm represent 200 tonnes present the above data using a compound bar graph.

Answer


Analyzing Crop Production Data