
Question
Study the diagram below and use it to answer the questions that follow.
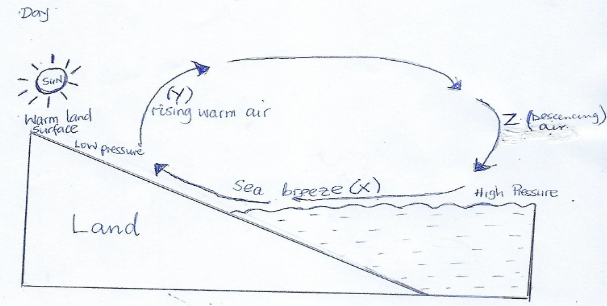
(i) State two ways through which the above phenomenon influence the climate of the adjacent land.
(ii) Identify areas in western Kenya where the phenomenon shown in the diagram above commonly occurs.
(i) State two ways through which the above phenomenon influence the climate of the adjacent land.
(ii) Identify areas in western Kenya where the phenomenon shown in the diagram above commonly occurs.
Answer
(i)
(ii) Near lakes such as around Lake Victoria
- The sea breeze brings a cooling effect to the adjacent land lowering the temperatures of the adjacent land.
- The sea breeze raises the humidity of the adjacent land.
- The sea breeze leads to formation of convectional rainfall.
(ii) Near lakes such as around Lake Victoria