Definition of Growth and Development and Its Concept
- Growth is a characteristic feature of all living organisms.
- Most multicellular organisms start life as a single cell and gradually grow into complex organisms with many cells.
- This involves multiplication of cells through the process of cell division.
- This quantitative permanent increase in size of an organism is referred to as growth.
Characteristics of Growth and Development
- Cells of organisms assimilate nutrients hence increase in mass.
- Cell division (mitosis) that lead to increase in the number of cells.
- Cell expansion that leads to enlargement an increase in the volume and size of the organism. It is therefore possible to measure growth using such parameters as mass, volume, length, height, surface area.
- On the other hand development is the qualitative aspect of growth which involves differentiation of cells and formation of various tissues in the body of the organism in order for tissues to be able to perform special functions.
- It is not possible to measure aspects of development quantitative.
- Therefore development can be assessed terms of increase in complexity of organism e.g. development of leaves, flowers and roots.
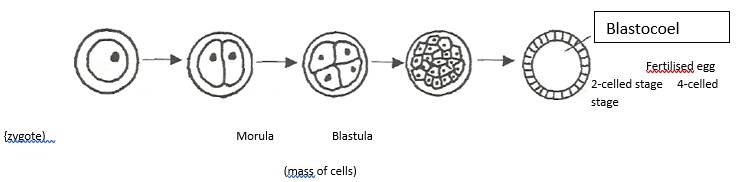
- During sexual reproduction mammals an ovum fuses with a sperm form a zygote.
- The zygote divides rapidly without increasing in size, first into 2, 4, 8, 16,32, 64 and so on, till it forms a mass cells called morula.
- These first cell division is called cleavages.
- The morula develops a hollow part, resulting into a structure known as a blastula (blastocyst).
- Later, blastocyst cells differentiate into an inner layer (endoderm) and the outer layer (ectoderm).
- The two-layered embryo implants into the uterine wall and, by obtaining nutrients from the maternal blood, starts to grow and develop.
- As the embryo grows and develops, changes occur in cell sizes and cell -types.
- Such changes are referred to as growth and development respectively.
- These processes lead to morphological and physiological changes in the developing young organism resulting into an adult that is more complex and efficient.
- In the early stages, all the cells of the embryo look alike, but as the development process continues the cells begin to differentiate and become specialised into different tissues to perform different functions.
- Growth involves the synthesis of new material and protoplasm.
- This requires a continuous supply of food, oxygen, water, warmth and means of removing waste products.
- In animals, growth takes place all over the body but the rates differ in the various parts of the body and at different times.
- In plants however, growth and cell division mostly take place at the root tip just behind the root cap and stem apex.
- This is referred to as apical growth which leads to the lengthening of the plant.
- However, plants do not only grow upwards and downwards but sideways as well.
- This growth leads to an increase in width (girth) by the activity of cambium cells.
- The increase in girth is termed as secondary growth.
Measurement of Growth in Plants and Animals
- Growth can be estimated by measuring some aspect of the organism such as height, weight, volume and length over a specified period of time.- The measurements so obtained if plotted against time result into a growth curve.
Example of a Growth and Development Question
| Time after sowing | Dry-mass of embryo (g) |
|---|---|
| 0 | 0.002 |
| 2 | 0.002 |
| 4 | 0.005 |
| 6 | 0.016 |
| 8 | 0.024 |
| 10 | 0.034 |
| 12 | 0.034 |
- Describe the shape of the graph.
- For most organisms when the measurements are plotted they give an S-shaped graph called a sigmoid curve such as in figure.
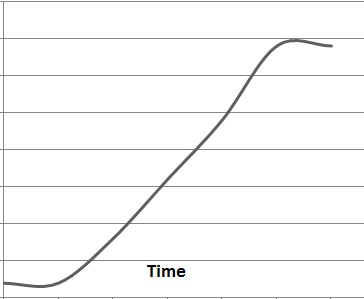
Sigmoid Curve of Growth
- A sigmoid curve may therefore be divided into four partsLag phase (slow growth)
- This is the initial phase during which little growth occurs.
- The growth rate is slow due to various factors namely:
- The number of cells dividing are few.
- The cells have not yet adjusted to the surrounding environmental factors.
Exponential phase (log phase)
- This is the second phase during which growth is rapid or proceeds exponentially.
- During this phase the rate of growth is at its maximum and at any point, the rate of growth is proportional to the amount of material or numbers of cells of the organism already present.
- This rapid growth is due to:
- An increase in number of cells dividing,2-4-8-16-32-64 following a geometric progression
- Cells having adjusted to the new environment.
- Food and other factors are not limiting hence cells are not competing for resources.
- The rate of cell increase being higher than the rate of cell death.
Decelerating Phase
- This is the third phase during which time growth becomes limited as a result of the effect of some internal or external factors, or the interaction of both.
- The slow growth is due to:
- The fact that most cells are fully differentiated.
- Fewer ceils still dividing.
- Environmental factors (external and internal) such as:
- shortage of oxygen and nutrients due to high demand by the increased number of cells.
- space is limited due to high number of cells.
- Accumulation of metabolic waste products inhibits growth. limited acquisition of carbon (IV) oxide as in the case of plants.
Plateau (stationary) phase
- This is the phase which marks the period where overall growth has ceased and the parameters under consideration remain constant.
- This is due to the fact that:
- The rate of cell division equals the rate of cell death.
- Nearly all cells and tissues are fully differentiated, therefore there is no further increase in the number of cells.
- The nature of the curve during this phase may vary depending on the nature of the parameter, the species and the interns! factors.
- In some cases, the curve continue to increase slightly until organism dies as is the case monocotyledonous plants, man invertebrates, fish and certain reptiles. indicates positive growth.
- In some other cases the curve flattens out indicating change in growth while other growth curve may tail off indicating a period of negative growth rate.
- This negative pattern characteristic of many mammals including humans and is a sign of physical sense associated with increasing age.