Question
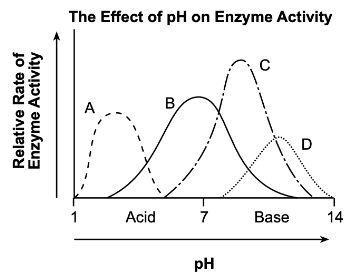
The graph shown below represents the rate of reaction of different enzymes when
subjected to varied pH levels

(a) With a reason, name the part of the alimentary canal where enzyme A is found
(b) The rate of reaction for enzyme B declines after pH 7. Explain

(a) With a reason, name the part of the alimentary canal where enzyme A is found
(b) The rate of reaction for enzyme B declines after pH 7. Explain
Answer
(a) Stomach-:Has Maximum reaction in acidic pH
(b) High pH / Alkaline pH denatures the enzyme.

