Esoma-KE Logo
Change Class  |  Change Subject

Photograph Work | Geography Form Two

Photograph Work

  Change Class FORM TWO
Select Subject  |  Geography
  Change Topic

Guest Account

Hello Guest, Create an Account or Login to save your progress and get unlimited access to more notes, revision exercises and answers.

Feeling Ready?

Attempt Form Two Geography Questions
Guest Account
Hello guest, kindly login to access unlimited study notes and revision questions.

Create an account / login to help track your progress and unlock more features including additional notes, rapid quizzes, revision questions, virtual library, and the new Esoma Classroom

Photograph Work

A photograph is an image of an object, person or scene recorded by a camera on a light sensitive film or paper.

Read More On

Types of Photographs

1. Ground Photographs
- Taken from the ground. They are of 2 types:
Ground Horizontals - taken with the camera at the same level as the object. They are of 2 types.
Ground close ups/particular view photographs - taken from the ground with a camera focused on one particular object.
Ground General View Photographs - taken from the ground with camera focused on general scenery.
Ground Obliques - taken from the ground with a camera slanting/held at an angle.

2. Aerial Photographs
- Taken from the air e.g. from aircrafts, balloons or satellites. They are of 2 types:
Aerial Obliques - taken from the air with camera tilted towards the ground.
Vertical Aerial Photographs - taken from the air with the camera directly above the object or scenery.

Parts of a Photograph

- A photograph is divided into nine ports as shown in the image below.

Parts of a Photograph - Geography Form One

Uses of Photographs

  • Used in learning geography because they bring unfamiliar features in the classroom enabling the students to understand them better.
  • Photographs showing vegetation and human activities can be used to deduce the climate of an area.
  • Aerial photographs show vital information on land use.
  • Photographs showing land forming processes help us to understand those processes.

Limitations in the Use of Photographs

- Coloured photographs are generally expensive to produce.
- Black and white photographs don't show the real colours of objects or scenery e.g. it’s difficult to distinguish ripe coffee berries from green ones.
- Some aerial photographs have objects which are far away and hence unclear which may lead to the wrong interpretation.
- Vertical aerial photographs are difficult to interpret without special instruments like stereoscopes.
- Photographs are difficult to interpret if they are blurred because it’s difficult to distinguish objects which look similar e.g. wheat and barley.

Interpretation of Photographs

- Means to explain the meaning of the objects or features on a photograph. It involves the following:

Determining the Title
Photographs show human activities, physical features, natural catastrophes etc e.g. nomadic pastoralism, drought, flooding, etc. when determining the title examine the photograph carefully and apply the knowledge you have learnt in geography.

Estimating Time
- In the tropics the shadows are short at noon and longest in the morning and afternoon.
- If the camera is facing south and the shadow is cast to the right it’s in the morning and if cast to the left it’s in the afternoon.

Estimating Season
Dry season
    - Bright clear skies
    - Dry vegetation
    - Harvesting
    - Light clothes e.g. shirts and T-shirts since temperature is high (also an - Indication of high temperature.
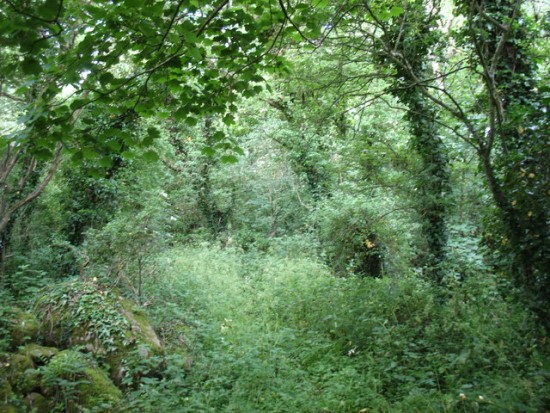
Rainy season
    - Rain clouds
    - Luxuriant vegetation
    - Young crops
    - Flowering plants
    - Weeding
    - Heavy clothing e.g. pullovers or jackets since temps are low (also an indication of cool season).

Determining Compass Direction
It it’s in the morning and the shadow of flag pole is cast to the left the photographer is facing north and if cast to the right he was facing south.
It it’s in the morning and the shadow is facing towards you the photographer was facing east and it taken in the afternoon and the shadow is facing towards you the photographer was facing west.

Interpretation of Physical Features on Photographs

Relief
Flat land
  • Rice crop
  • Irrigation
  • Combine harvesters
  • Swamps
  • Meanders
  • Oxbow lakes
  • Inselbergs (isolated hills)

An Inselberg - Geography Form Two
An Inselberg - Picture Courtesy

Hilly/Mountainous landscape/Highland Area
  • Steep slopes
  • Terraced landscape
  • Tea, wheat crops which grow at high altitude
  • rapids
  • Water falls
  • Interlocking spurs

Rapids - Geography Form Two
Rapids - Picture Courtesy

Drainage
Youthful Stage
  • Rapids
  • Waterfalls
  • Interlocking spurs
Middle Stage
  • meanders
  • oxbow lakes

Meanders - Geography Form Two
Meanders - Picture Courtesy

Lower Stage
  • deltas
  • distributaries
  • meanders and oxbow lakes
  • flood plain

Delta - Geography Form Two
Delta - Picture Courtesy

Vegetation
Natural
  • Indigenous species
  • Dense undergrowth
  • Trees grow haphazardly
  • Different species of trees
  • Not of the same height


Dense undergrowth - Geography Form Two
Dense undergrowth - Picture Courtesy

Planted
  • Exotic species
  • In rows
  • Little undergrowth
  • Same species
  • Same heights
Tropical Rain Forests
  • Trees
  • Broad leaves
  • Umbrella shaped
Marshes
  • swamps
Savannah Grassland
  • Grass and short trees (woodland).
Desert Vegetation
  • Thorny leaves
  • Baobab and acacia
  • Scrub-land covered with shrubs and underdeveloped trees (shrubs).


Climate
High Temperatures and low rainfall
  • Sugar cane
  • Grass
  • Sisal
  • Scrub and bush land vegetation
  • Dense forests
  • Light clothes


Cool Temperature and High rainfall (Sufficient, Reliable and well distributed)
  • Tea
  • Coffee
  • Wheat
  • Dairy farming


Soils
Acidic and Volcanic Soils
  • Coffee
  • Tea
Clay Soils
  • Rice
Black Cotton Soils
  • Cotton
  • Rice
Loamy Soil
  • Horticultural crops

Sketching Diagrams from Photographs

  • Draw a rectangle the same size as the photograph.
  • Divide it into squares using faint lines.
  • Subdivide the photograph into 9 sections.
  • Insert the features in their exact positions using simple lines being guided by the squares.
  • Label the important features e.g. vegetation, land use, prominent buildings, transport, and communication.
  • Give the sketch a suitable title.

Graphs

Graphs are two-dimensional drawings which show relationships between 2 types of data representing two items also called variables.
These are dependent variable which is affected by the other e.g. temperature (on y axis) and independent variable whose change is not affected by the other e.g. altitude (on x axis)

What a Well Drawn Graph Should Have
  • Title
  • Scale/scales
  • Labelled and marked x and y axis starting at zero.
  • Key if required e.g. in comparative bar graph.
  • Accurately plotted and lines, curves or bars properly drawn.
Simple Line graph
Advantages
  • Easy to construct
  • Easy to interpret
  • Easy to read/estimate exact values.
  • Shows trend or movement overtime.
Disadvantages
  • Doesn’t give a clear impression on the quantity of data.
  • May give false impression on the quantity especially when there was no production.
  • Poor choice of vertical scale may exaggerate fluctuations in values.
  • Difficult to find exact values by interpolation.


Simple Bar Graph/histogram
The following is data from which a simple bar graph is drawn, it represents members joining an organization for the dates indicated
After the data is the illustration of the resulting bar graph.

Simple Bar Graph - Geo Form Two

Simple Bar Graph - Geo Form Two

Advantages
  • Easy to construct.
  • Easy to interpret.
  • Easy to read.
  • Gives a clear visual impression on the quantity of data.
Disadvantages
  • Poor choice of vertical scale may cause exaggeration of bars.
  • Doesn’t show continuity/ variation of data overtime.
  • Unsuitable technique when values exist in continuity.
  • Not possible to obtain intermediate values from the graph.


Combined Line and Bar Graph
Advantages
  • Easy to construct.
  • Easy to read.
  • It shows relationship between two sets of data.
Disadvantages
  • Difficult to choose suitable scale when values of variables differ by great magnitude.
  • Considerable variation of data represented by the line may cause the line the bars thus obscuring the relationship.
  • Doesn’t show relationship between the same sets of data of more than one place.
Example of a Combined Line and Bar Graph for Temperature and Rainfall in Kajiado

Temperature and Rainfall for Kajiado -Geo Form Two

Analysis and Interpretation
  • The month with heaviest rainfall is May.
  • The month with lowest rainfall is July.
  • The hottest month was January and February.
  • The months with lowest temperature were June and July.
Comparative/Group/Multiple Line Graph

Image Caption-Geo Form One

Advantages
  • Simple to construct
  • Suitable when comparing trends or movements
  • Comparison of items is easy because the graphs are drawn using common axis
  • Its easy to read exact values from each graph
Disadvantages
  • Number of items which can be represented are limited
  • Crossing of lines may make interpretation and comparison difficult and confusing.
  • Total amount of variable cant be established at a glance.


Comparative Bar Graph
Advantages
  • Easy to construct
  • Easy to read and interpret
  • Easy to compare similar components within different bars.
  • Gives a good impression of totality.
  • Individual contribution made by each component is clearly seen.
  • Differences in quantity of components are clearly seen.
Disadvantages
  • Doesn’t show trend of components over time.
  • Not easy to compare components where bars are many
  • Not suitable for many components

Hello Guest, Please help review these notes.    Why review

Your review has been successfully submitted.
Tell us what you think about the notes.

Submit Comment