Esoma-KE Logo
Back to Chemistry Questions  | 

Chemistry Question Form 1

  Back to Chemistry Questions
Select Subject  |  Chemistry

Guest Account

Posting a question helps you get possible answers from the 8000+ Secondary Students and TSC Teachers .

If you need help posting your question, contact us on 0742 683841 or click the help link provided.

 Got a Question? Post It!

The diagram below represent a graph obtained when substance A was heated ...

Eliud Talam Asked 20/03/2021 At: 19:42 PM
The student asked
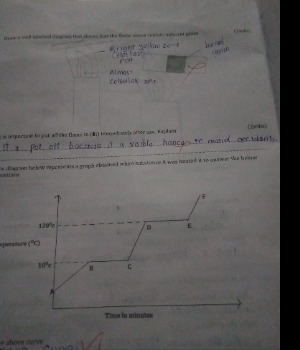
The diagram below represent a graph obtained when substance A was heated it to answer the below questions
Qn1 Name the above curve
Qn2 Explain why the temperature remains constant at region BC
Qn3 Is A pure substance or impure substance.explain
Qn4 When sodium chloride is added to substance A it boiled at 130 degree per Celsius . Explain the observation made.
     
LogIn to Answer this Question
Answers
Loading Available Answers. Please Wait ...